Find Treatment By
Rehabs by Location


Find Treatment By
Learn
About Us
Recovery.com combines independent research with expert guidance on addiction and mental health treatment. Our mission is to help everyone find the best path to recovery through the most comprehensive, helpful network of treatment providers worldwide.
Advisory Council
Our advisory council brings together leaders in behavioral health, technology, and business. Their diverse expertise ensures our resources and product are innovative, evidence-based, and effective. They guide our mission as accomplished individuals dedicated to improving the landscape of addiction recovery and mental wellness.
What “Good” Looks Like in Behavioral Health Marketing: Spend, Mix, and Conversion Benchmarks
Clint Mally is the Vice President of Content at Recovery.com, where he leads creative strategy rooted in one guiding belief: communication is a form of care. Drawing on his background in education, storytelling, and behavioral health marketing, he helps make recovery information accessible, empathetic, and empowering.
Clint Mally is the Vice President of Content at Recovery.com, where he leads creative strategy rooted in one guiding belief: communication is a form of care. Drawing on his background in education, storytelling, and behavioral health marketing, he helps make recovery information accessible, empathetic, and empowering.
Marketing a treatment center has never been more complex. New channels keep emerging, costs keep rising, and teams are under constant pressure to produce more admits with fewer resources. Many leaders are left wondering the same thing:
Are we actually doing this right?
To help answer that question, we surveyed behavioral health leaders and marketing professionals and asked them to step back from tactics and think strategically about where admits should come from, how budgets should be allocated, and what actually drives conversion.
This article walks through the exact questions we asked, what the data revealed, and how you can use these insights to pressure-test your own marketing strategy.
Where Should Admits Come From?
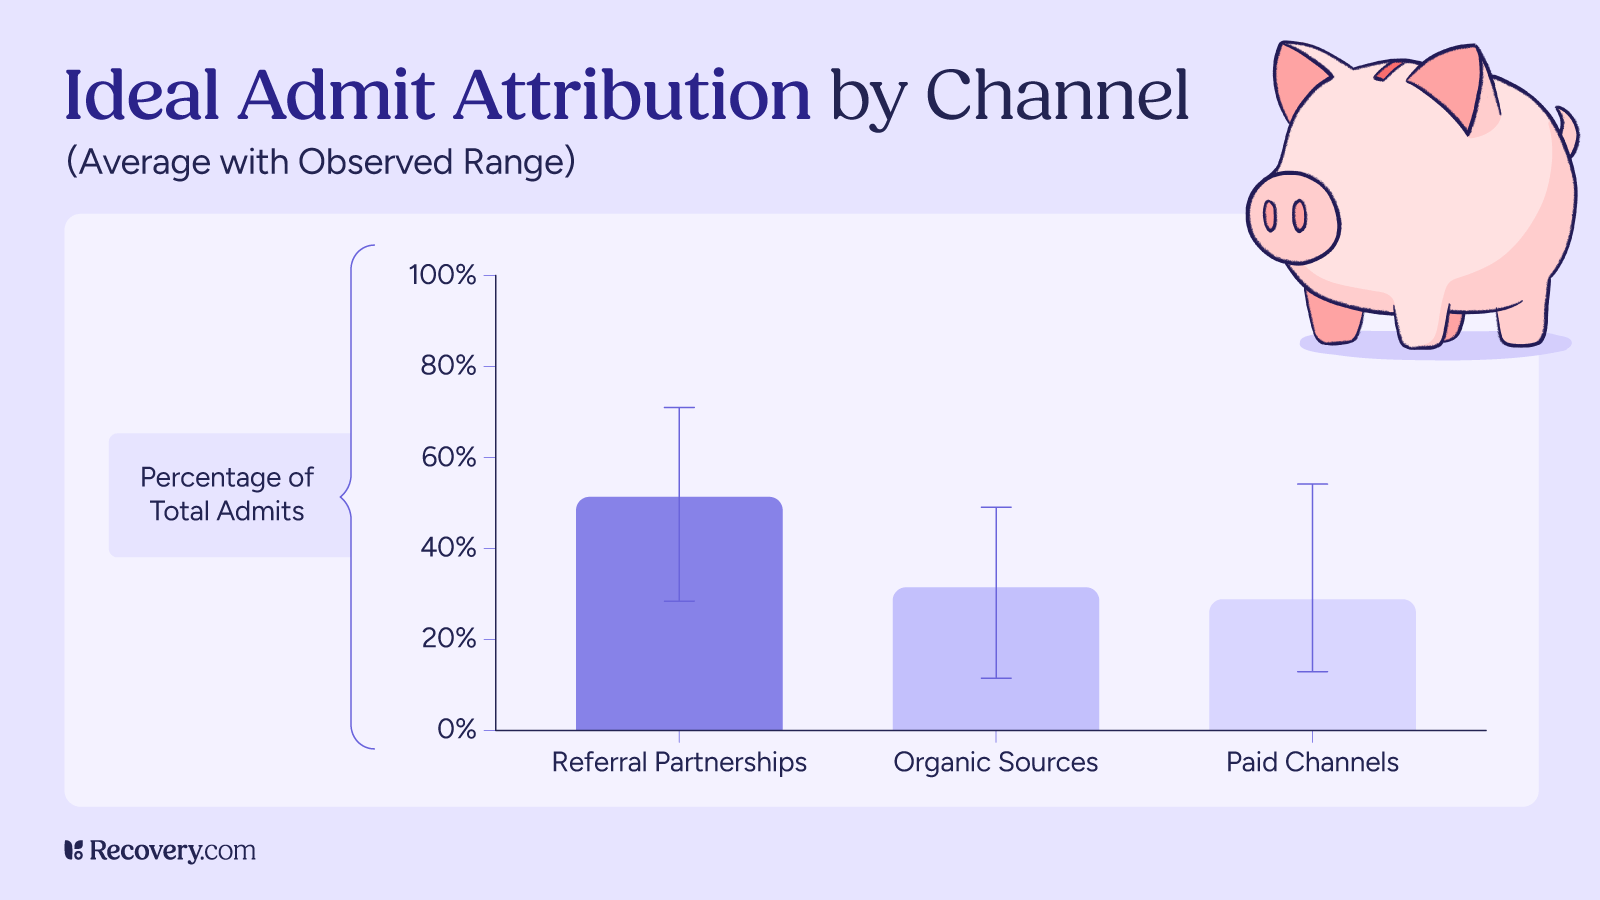
We asked respondents to imagine a 100-admit month and break down where those admits should ideally come from across three buckets:
- Referral partnerships (business development reps, professional referrals, alumni)
- Organic sources (SEO, content, social media, direct)
- Paid channels (PPC, paid social, directories and treatment navigation platforms)
Across responses, a clear average pattern emerged:
- Referral partnerships: ~50% of total admits on average
- Organic sources: ~30% of total admits on average
- Paid channels: ~25–30% of total admits on average
While individual responses varied widely depending on market and model, the takeaway was consistent: most experienced operators expect the largest share of admits to come from referral-based relationships, with organic and paid channels playing complementary roles.
Rather than chasing a perfect percentage split, this benchmark is best used as a gut check. If the majority of your admits are expected to come from paid channels alone, it may signal over-reliance on volume rather than quality.

What Assumptions Shape Channel Mix?
When responses varied widely, they almost always varied for good reasons.
Leaders pointed to several factors that meaningfully change what a “healthy” mix looks like:
- Market competitiveness: Highly saturated markets tend to rely more on paid and organic channels to maintain visibility.
- Program size: Larger programs often need paid channels to consistently fill beds, while smaller programs can rely more heavily on referrals.
- Acuity and length of stay: Higher-acuity programs benefit disproportionately from referrals due to better fit and preparedness.
- Payer mix: Cash-pay and private-pay programs see stronger performance from referrals and organic; insurance-heavy models often require more paid volume.
This is an important reminder: benchmarks are guides, not rules. Being “off average” doesn’t automatically mean something is wrong — as long as the underlying assumptions make sense.


How Should the Marketing Budget Be Allocated?
We then asked respondents how they believe marketing budgets should be allocated across the same three buckets.
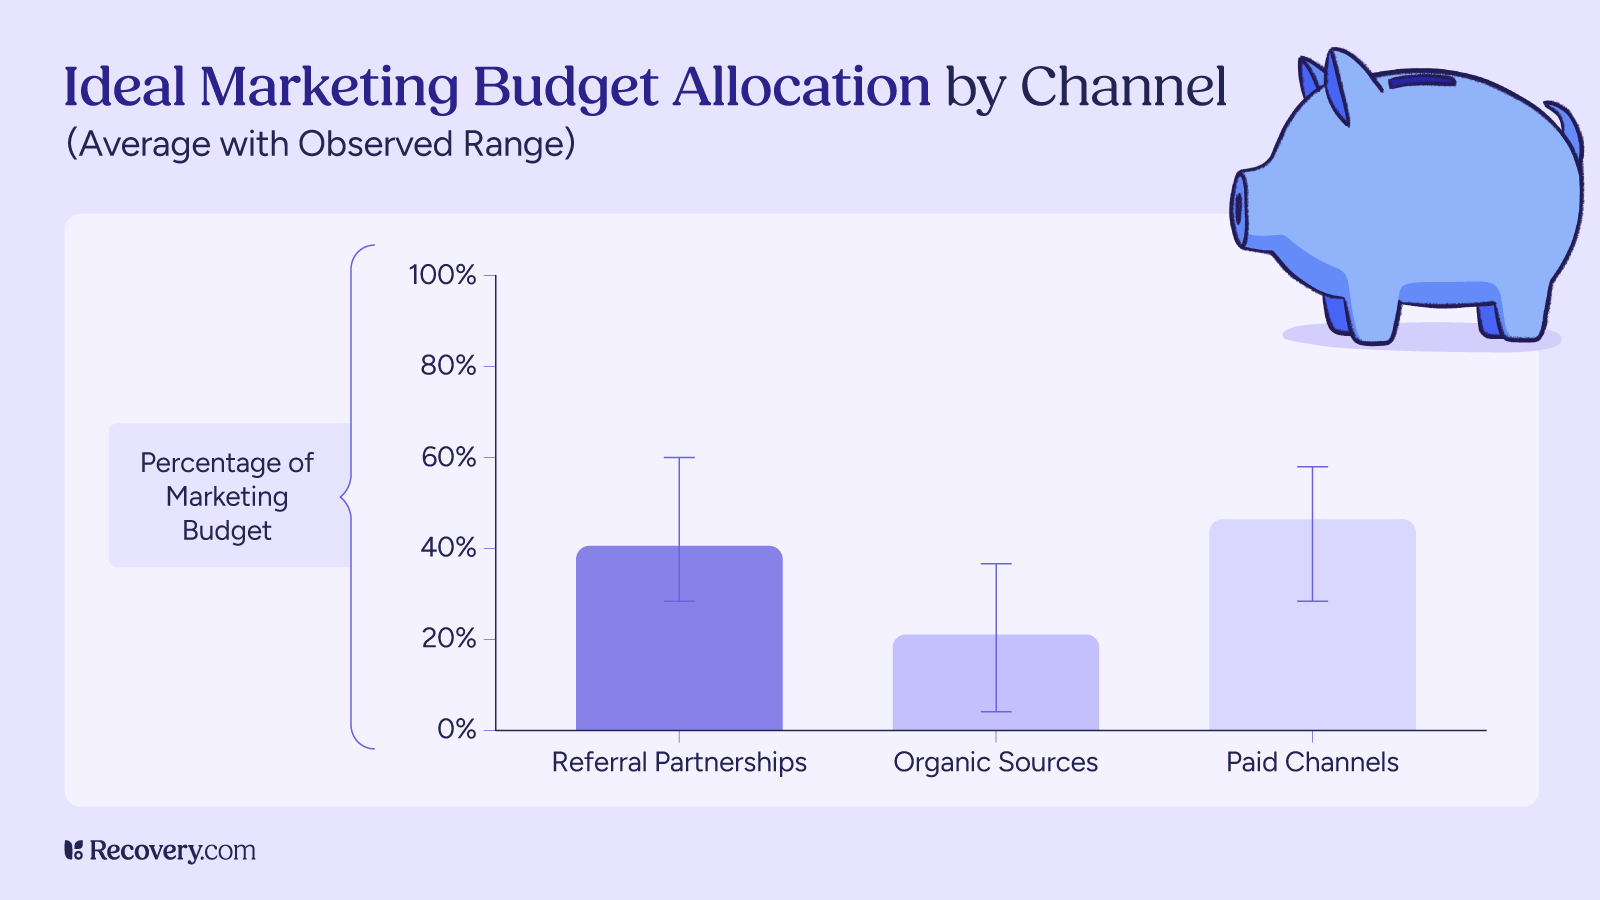
On average, leaders recommended the following budget distribution:
- Referral partnerships: ~40% of marketing spend
- Organic sources: ~20% of marketing spend
- Paid channels: ~45% of marketing spend
This reveals an important tension. Paid channels tend to receive the largest share of budget, not because they perform best, but because they are easier to scale, measure, and turn on quickly. Referral partnerships, despite being viewed as the highest-quality source of admits, often receive less investment because they require time, people, and long-term relationship building.
The result is a familiar pattern: teams spend where growth feels most controllable, even when returns are weaker downstream.
Where Is the Biggest Gap Between Spend and Admits?
This question surfaced the clearest opportunity for most treatment centers.
Across responses, referral partnerships stood out as the largest gap between spend and results. While they consistently drive the highest-quality admits and strongest conversion, they often receive less investment than paid channels.
Paid marketing showed the opposite pattern: meaningful spend paired with weaker downstream performance unless supported by strong qualification and admissions processes.
The implication is not to abandon paid channels — but to recognize that money alone doesn’t fix inefficiency. Without the right funnel and follow-up, paid traffic simply exposes operational weaknesses faster.
How Do Channels Actually Convert?
When we asked respondents to identify the biggest driver of conversion, the answer wasn’t a channel — it was what happens after the lead comes in.
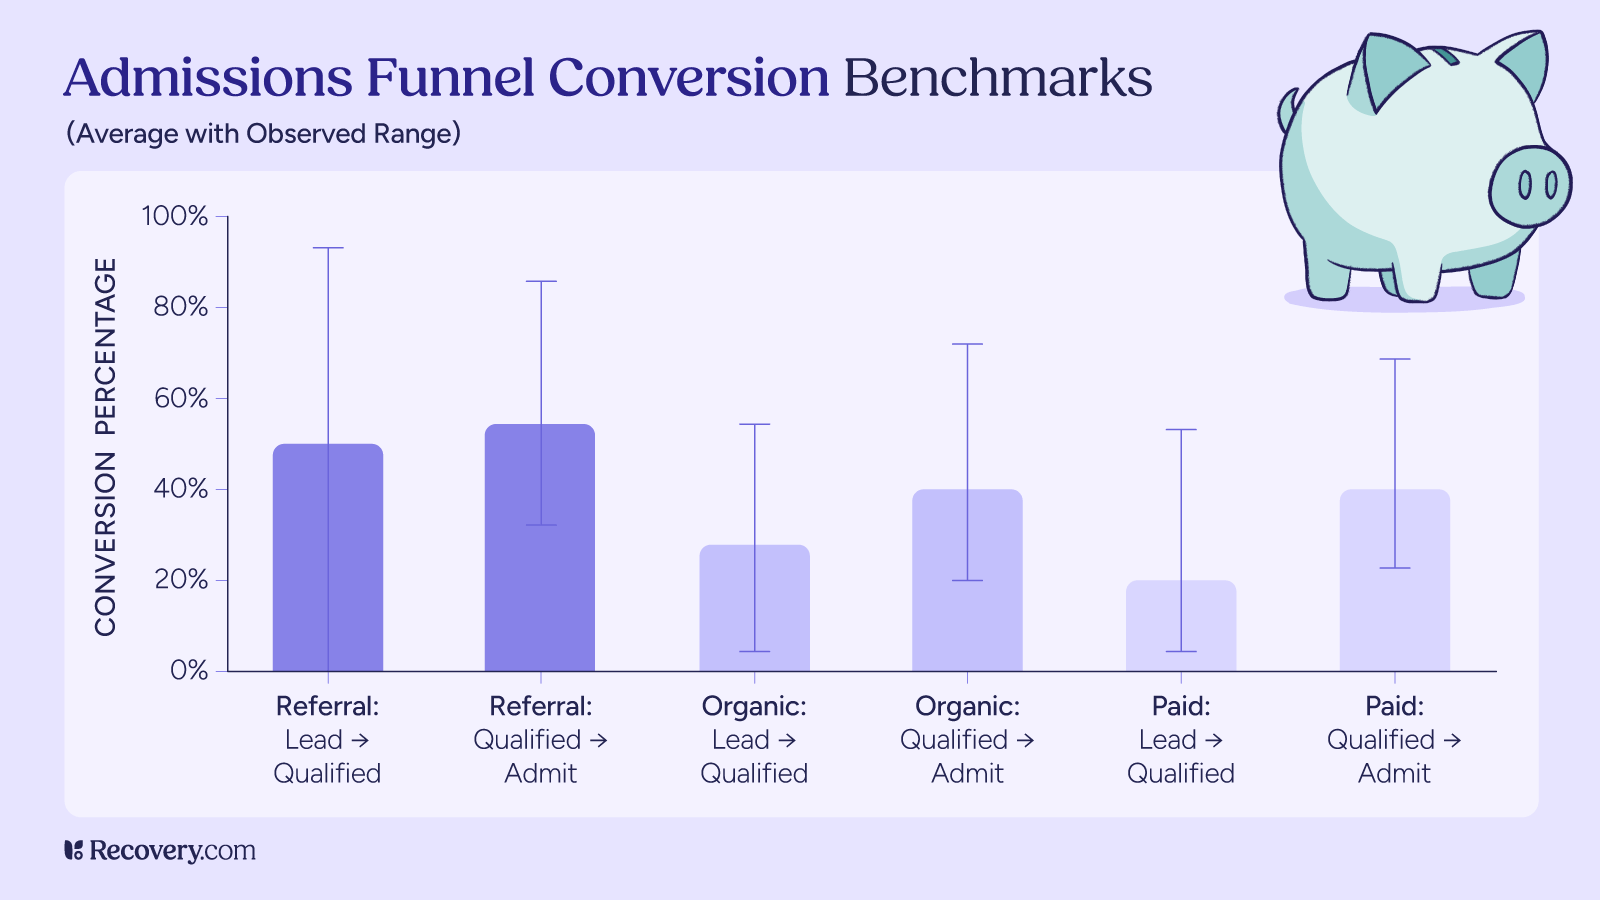
Average conversion benchmarks across channels looked like this:
- Referral partnerships:
- Lead → Qualified: ~50%
- Qualified → Admit: ~54%
- Organic sources:
- Lead → Qualified: ~26%
- Qualified → Admit: ~41%
- Paid channels:
- Lead → Qualified: ~21%
- Qualified → Admit: ~40%
The pattern is clear: referral leads convert best at every stage of the funnel, organic sits in the middle, and paid produces the weakest qualification rates.
Because of this, respondents consistently pointed to the same lever for improvement across all channels:
- Speed to first contact
- Quality of qualification
- Admissions team skill and consistency
- Clear communication of fit, trust, and next steps
This also helps explain why some paid sources outperform others. Treatment navigation platforms like Recovery.com tend to attract people further along in the decision-making process, which improves qualification rates and reduces wasted admissions calls compared to broad, early-stage paid traffic.
Also, its free to claim and list your center on Recovery.com
One thing that’s absolutely critical to leads and conversions is the quality of your website, especially your treatment center’s location pages. These pages often do more of the conversion work than people realize.
There’s a lot that goes into getting them right, and we’ve already done a full episode on the 16 things every treatment center website should include. Consider this one of the most important conversion-optimizing moves you can make.
What This Means for Your Treatment Center
If you’re trying to determine whether your marketing is “on the right track,” these insights offer a simple framework:
- Expect referrals to convert best — and make sure they’re not underfunded
- Use organic channels as a long-term growth engine, not a quick fix
- Treat paid channels as accelerators, not foundations
- Audit your admissions and follow-up process before changing spend
Most importantly, resist the urge to chase volume at the expense of quality. The centers that perform best over time are rarely the ones generating the most leads — they’re the ones converting the right ones.
If you want a clearer picture of how your strategy compares, tools like Recovery.com can help you understand where high-intent demand already exists and how to connect with people who are ready for care.
Marketing will always involve experimentation. But with the right benchmarks, you can experiment with confidence — and know when you’re truly on track.

Survey Contributors
- Zach Gross — MGMT Digital
- Matthew Fung-A-Fat — ADVENT
- Daniel Krasner — Sero Mental Health
- Nolan O’Malley — Newport Healthcare
- George Kocher —Brand North
- Derek Hyman — Scalable Growth
- Nick Jaworski — Circle Social Inc.
- Steve Donai — Growth Sherpa Consulting
- Wade Muhlhauser — Plugged In Recovery
- Gary Garth — elev8.io
- Drew Powers
- Jeremy Manné — Pacific Crest Growth
- Daniel Henley — Red Rock Recovery Center
Our Promise
How Is Recovery.com Different?
We believe everyone deserves access to accurate, unbiased information about mental health and recovery. That's why we have a comprehensive set of treatment providers and don't charge for inclusion. Any center that meets our criteria can list for free. We do not and have never accepted fees for referring someone to a particular center. Providers who advertise with us must be verified by our Research Team and we clearly mark their status as advertisers.
Our goal is to help you choose the best path for your recovery. That begins with information you can trust.